Embedded Analytics in a few simple steps

The fastest way to embed Analytics delivering analyses, reports, and dashboards is using IFRAME HTML object and additional attributes that customize the appearance within the host website or web application. Embed analytics based on OLAP, SQL, or Self-Service BI (Analytic Models). Embed existing analysis/report or provide embedded blank analysis surface for end-users to analyze data within the host page from scratch.
Embedded Analytics

OLAP & Self-Service BI

Embedded Analytics supports OLAP and Self-Service BI data analysis. Existing OLAP or Self-Service BI analysis could be embedded or an empty page to start new analytics.

Report Caching

The initial opening of embedded analytics could retrieve fresh data or display the cached data and reduce the impact on data sources when opened by many concurrent users.

Customize Visuals

In the process of publishing embedded analytics, many visual options are available to choose from to match the host page style and structure.

Published Analytics URL

Prepared analytics could be opened on a defined URL as a standalone page with published analytics or embedded into another web page within the HTML IFrame element.

Impersonate Options

Opened analytics (embedded or as a standalone page) could be impersonated by the current user or a specific Windows account while connecting to data sources.

Embed Dashboards

Organize multiple analytics to an interactive dashboard that is embedded within an IFrame with additional query string parameters to control the displayed layout.

Published Analytics

When created analytics/reports are required to be used outside the Kyubit application, by any users (who do not have permissions in related data sources nor the Kyubit application), on the published URL. Here comes the 'publishing' feature, where you set a specific Windows account that is being used for connecting and querying data sources (optionally set using the current user impersonation if required). Such published analytics could be embedded into another web page or displayed as a standalone page. The initial opening of embedded analytics could retrieve new/fresh data or display the cached data and reduce the impact on data sources when used by many concurrent users.
Published Embedded Analytics
Process of defining the published analytics details. 'Report Alias', 'Cache time' in minutes, 'Impersonate' option and selecting appropriate 'Visual elements'.
Published Embedded Analytics

OLAP software Prepare Embedded Analytics Report within your web page.

Follow steps to integrate Embedded Analytics Report:

  • Create new Analysis (Grid/Chart) of your preference and save it.
  • Within analysis, click on the 'Report' view and then on the 'Publish' button.
  • New 'Publish' window is showing analysis report with many visual and behaviour attributes that could be customized in this view.
  • Optionally set 'Impersonation' user.
  • Optionally set 'Caching' user.
  • Give analysis 'alias' name, under which it will be accessed.
  • Mark 'Published' attributed and click 'Save' button to finally publish analysis.
  • Analysis is now accessible under URL displayed at the top of Publish window.
  • Automatically, IFRAME HTML content is displayed ready to copy/paste to your web site to show configured and published Embedded Analytics report.

<iframe src='http://YourKyubitSiteURL/Report.aspx?Analysis=alias' frameborder='0' vspace='0' hspace='0' 
marginwidth='0' marginheight='0'  width='100%' height='100%' scrolling='no'  />


Embedded Analytics, Embedded BI

OLAP software Integrate Dashboard Embedded Analytics with your web sites using IFRAME

Dashboard created within Kyubit Business Intelligence could be easily embedded in any HTML page using IFRAME element, allowing number of configuration options to customize dashboard appearance to best fit visually into existing HTML page.

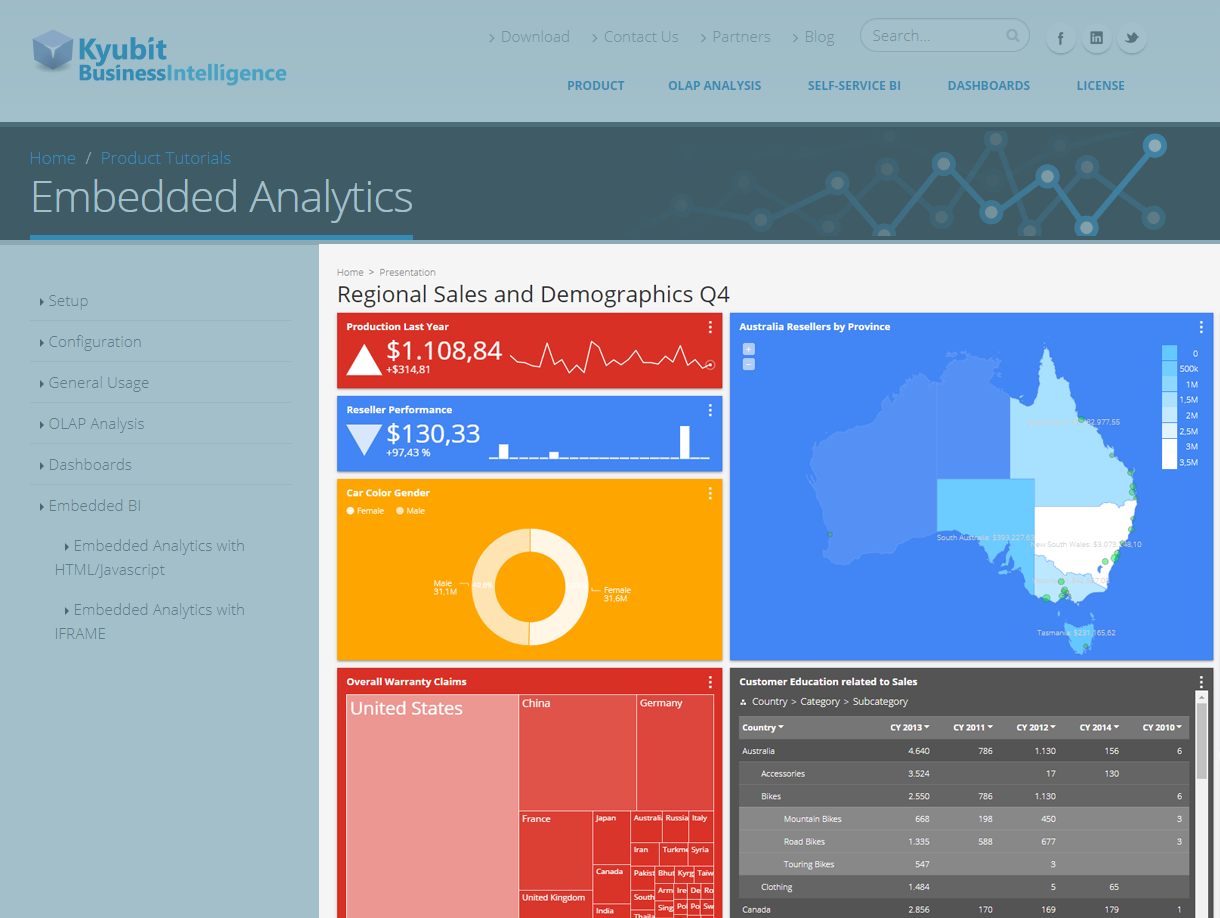
Simple example of embedded dashboard using IFRAME element:
<iframe src="http://YourKyubitSiteURL/Forms/Dashboard.aspx?DashboardID=3" width="800px" height="1000px" 
  frameborder="0" scrolling="no"></iframe>    
Add IFRAME element and set SRC attribute to URL of the dashboard from Kyubit Business Intelligence application (Same URL if opened from Kyubit Business Intelligence application). Additional URL attributes to customize dashboard appearance:

  • Align, alignment of the dashboard within IFRAME element.
  • Font, dashboard fonts.
  • FontColor, dashboard font color.
  • TileFontSize, dashboard title size.
  • HideDesignButton, hides ‘Design’ button
  • HideCloseButton, hides ‘Close’ button
  • HideOpenPDFbutton, hides ‘Open PDF’ button
  • HideSubscribeButton, hides ‘Subscribe’ button
  • HideToolbar, hides complete toolbar with icons button
  • HideFilters, hides ‘Filter’ button

Example with all attributes:
<iframe id="dashFrame" src="http://YourKyubitSiteURL/Forms/Dashboard.aspx?DashboardID=3
    &align=right&font=helvetica&fontColor=red
    &tileFontSize=11px&hideDesignButton=1&hideCloseButton=1
    &hideOpenPDFbutton=1&hideSubscribeButton=1&hideToolbar=1&hideFilters=1" 
    width="800px" height="1000px" frameborder="0" 
    scrolling="no"></iframe>   
Embedded Analytics, Embedded BI


Get started with Kyubit BI tools

BI tools download Download 30 days evaluation of 'Kyubit Business Intelligence' and see Embedded Analytics features in action.
It is a simple and quick installation that will bring all features unlocked in evaluation version. We will be happy to hear your feedback.