When it comes to identifying the lowest structure of your OLAP analysis data and actual entities from which whole measures are
aggregated, the Drill-through feature is an irreplaceable analytic tool, however Drill-through columns to return are
defined within OLAP cube definition and what if we need ad-hoc different drill-through columns to return? Should we call a
BI engineer to make the requested update in the cube or do we have some other options right now?
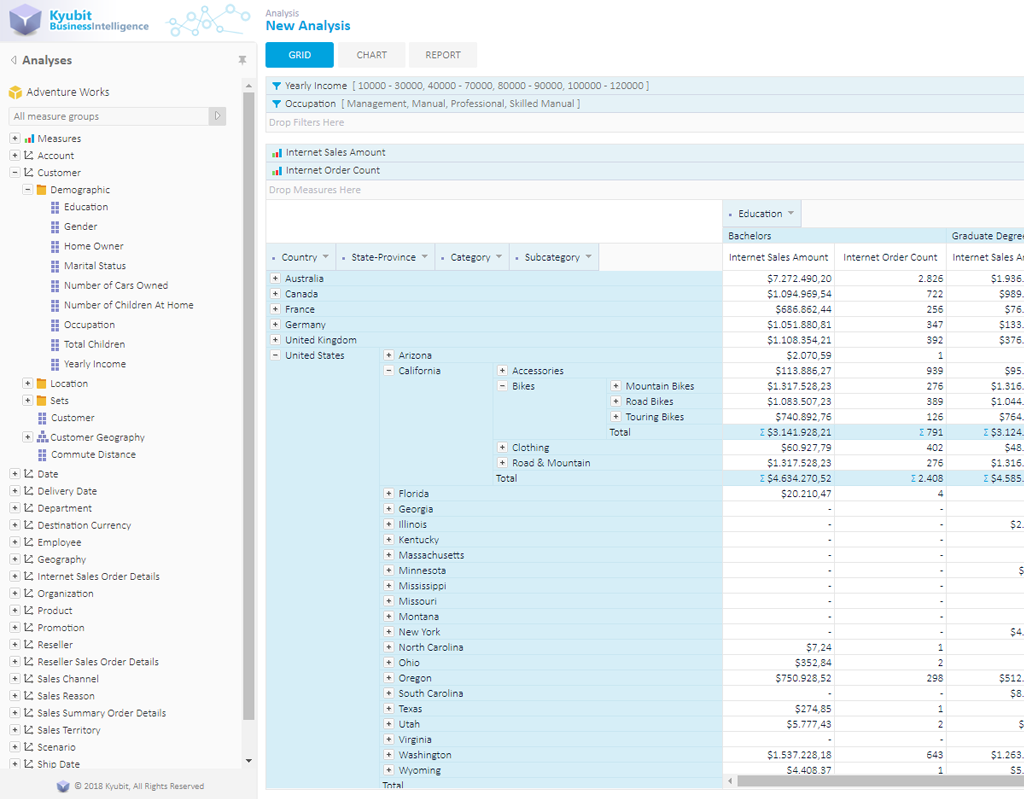
While analyzing your OLAP data with Kyubit Business Intelligence at any time in grid or chart view, you can
select to show Drill-through data with columns that are defined during OLAP design time, but you can also create
Custom Drill-through ad-hoc chosen set of columns that consists of dimension levels and measures to show detailed
data of your current analytic interest. This will add a new tool to your analytic arsenal as you will no longer
need to know drill-through columns in advance while designing your OLAP cube and possible details that an analyst
might ask while in production.
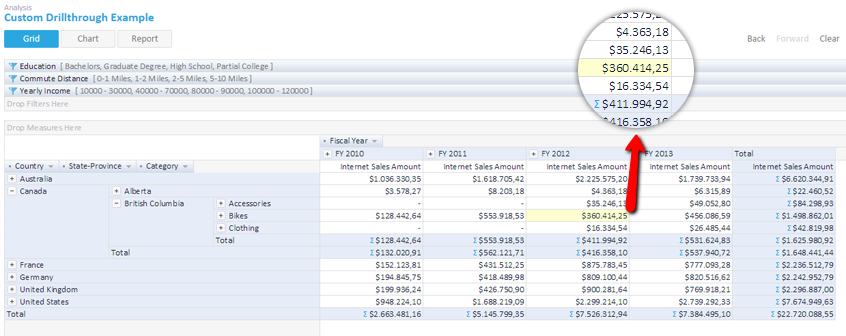
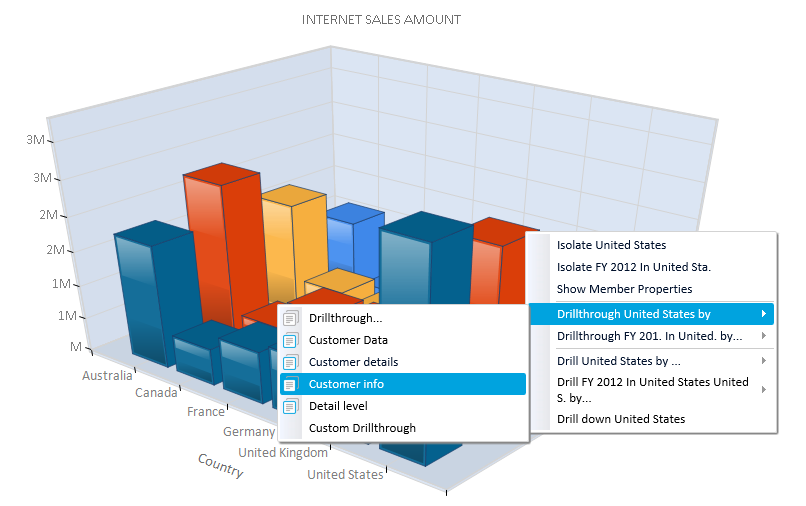
Simply right click on a returned OLAP cell value and select Custom Drill-through that will open a picker to select
columns (and their order) to return in your Drill-through action from OLAP dimensions and measures cube structure.
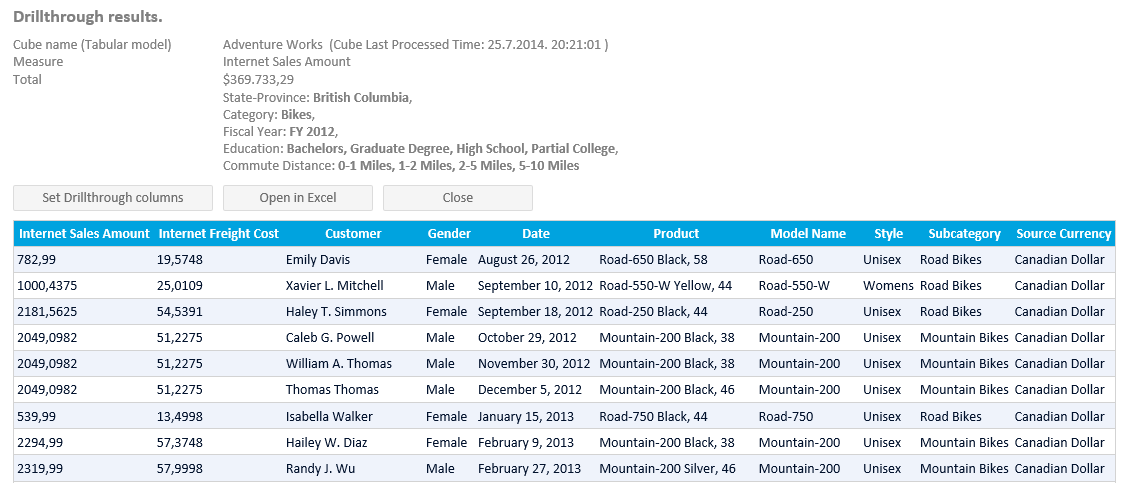
Drill-through results will show up in a separate window that you can maximize in case of large data outputs.
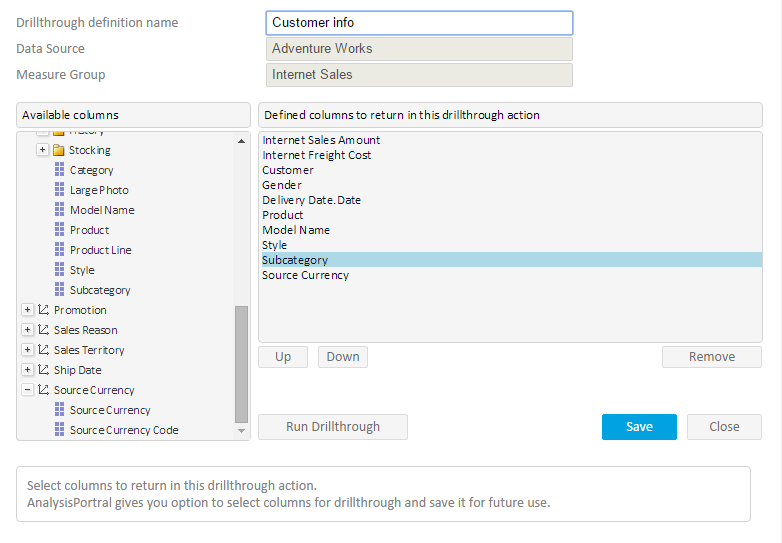
Furthermore, columns selected for Custom Drill-through can be saved for future usage and shared with other users!
Add permissions to users and groups that could use or change a created Custom Drill-through definition. This option
could be time saving for a group of analysts on their daily job.
Results of Drill-through action could be exported to an Excel file or printed out. Saved Custom Drill-through action
could be used in analysis on grid and chart view, but also on dashboard, if it contains OLAP related measure group
associated with Custom Drill-through.
The background of the described Custom drill-through action is to create command that includes MDX query
which will hold definition of OLAP cube segment as isolated portion of data to return requested columns
and column definitions from related relational (data warehouse) database that will be used to return data.
- Definition of OLAP dimension members that will be used to slice OLAP cube to segments we are interested in.
- Definition of columns from relational data warehouse database that will be returned as drill-through results
DRILLTHROUGH MAXROWS 25000 Select
(
[Date].[Fiscal].[Fiscal Year].&[2012],
[Customer].[Customer Geography].[State-Province].&[BC]&[CA],
[Product].[Product Categories].[Category].&[1],
[Measures].[Internet Sales Amount]
) on 0 From [Adventure Works]
RETURN
[$Measures].[Internet Sales Amount],
[$Measures].[Internet Freight Cost],
[$Customer].[Customer],
[$Customer].[Gender],
[$Delivery Date].[Date],
[$Product].[Product],
[$Product].[Model Name],
[$Product].[Style],
[$Product].[Subcategory],
[$Source Currency].[Source Currency]
Step-by-step creation and use of Custom Drill-through
- Create some grid or chart analysis by dragging and dropping some dimensions to the category, series, and filters area of analysis.
Select filter members to isolate the analysis segment that you would like to explore.
-
Right click on the cell of interest, select Custom Drill-through. When drill-through windows open, click Set Drill-through
columns and pick all dimension levels and measures you would like to see in your drill-through results.
Set the columns order of appearance and save the selected columns under some associative name for later use
(saving is optional).
-
Run the prepared drill-through which will display a list of drill-through results with columns you have defined.
On top of the results OLAP data which is isolated prior to drill-through action could be explored. At this moment
you can also choose to export drill-through results to an Excel file.
-
Also while in chart analysis view, right click on chart segment and select the same custom drill-through you have
created and saved previously to show same drill-through results at any time.
-
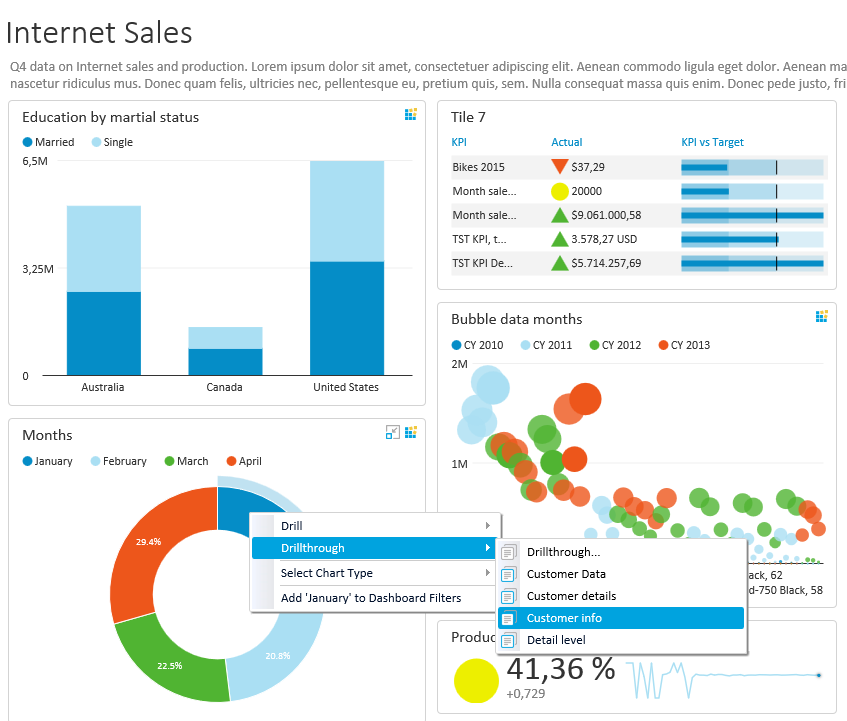
Dashboard tiles that are based on the same OLAP data source also have the option to use saved drill-throughs
and execute them while in dashboard view. Using OLAP features while in dashboard has great usability impact for end users.
Conclusion
Getting drill-through columns while analyzing OLAP data results is a fantastically useful feature for all analysts
while exploring business related data, because it gets to the bottom of all transactions that higher level
analysis insights consist of. The option to create ad-hoc custom drill-through columns to return is also immensely
useful, because an end user analyst could prepare his own sets of columns to return and would not need to wait for
engineers to include in OLAP cube design. Even better prepared drill-through columns could be shared with other users,
analyses, and dashboards!
Author
Kresimir Korovljevic
Software architect on numerous projects related to Microsoft technologies. Development and promotion of Business Intelligence software tools is primary focus and driving force.