Manage KPIs

Once created, KPI could be re-used on many dashboards with respect to defined permissions on the KPI.

All available KPIs to current user are visible in ‘Dashboards’ -> ‘KPI’ section of Kyubit Business Intelligence.

KPI Software

When one of dashboard tiles should display KPI, one must first be defined in the Kyubit Business Intelligence application to be used on dashboard itself. It could be right away created while in dashboard ‘Design’ view, without leaving working dashboard.

‘KPI Design’ form offers everything on one place to create KPI in Kyubit Business Intelligence application.

KPI Software

  • ‘KPI Name’, defines full name of the KPI in the system.
  • ‘KPI Short Name’, will be used on places (mobile device), where space is limited.
  • ‘KPI Description’, simply described KPI structure for other users.
  • ‘Success Model’, defines if higher values are more successful or lower values are more successful.
  • ‘KPI Value’ is actual value that is tested for KPI success. Could be configured as ‘Fixed numeric value’ or value from ‘Query/Analysis’.
  • ‘Success threshold’, defines limit above KPI status is consider as ‘Success’ and marked with green arrow icon. Could be configured as ‘Fixed numeric value’ or value from ‘Query/Analysis’.
  • ‘Fail threshold’, defines limit bellow KPI status is considered as ‘Failed’ and marked with red arrow icon. Could be configured as ‘Fixed numeric value’ or value from ‘Query/Analysis’.
  • If ‘KPI value’ is between ‘Success’ and ‘Fail’ limit, KPI is in the ‘Even’ status and marked with yellow circle.
  • ‘Last change as percentage’, defines if last change will be displayed as percentage or regular delta value.
  • ‘Show KPI values line chart’, defined if line chart will be visible next to KPI to reflect changing of data through time, up to last (current) value. KPI data feed is based on series of values (first series of analysis/query) and last value in series is considered as current value to be evaluated for KPI, previous values are considered as historic and could be displayed as list chart next to KPI indicator.


When all inputs are selected, click on ‘Test KPI’ to immediately display KPI visualization and perhaps make correction, before it is closed.
Data to display KPI comes from ‘Analysis’ (existing analysis within Kyubit Business Intelligence application), ‘MDX Query’ or ‘TSQL Query’. Value to be evaluated as relevant for KPI is the last value in the first series of values retrieved from analysis or query. All other values before last values are considered as historic supplement of values and are used to describe trend and last value change (delta).

KPI Software

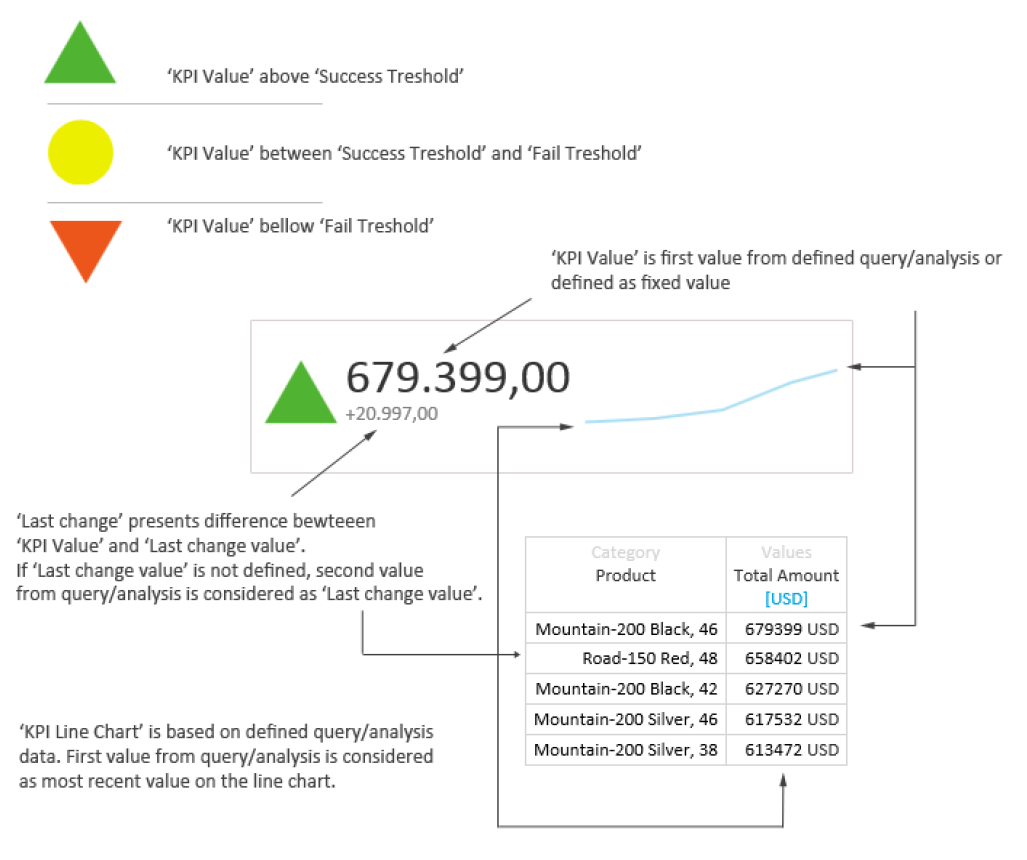
KPI value is first value in first series of query values, other values are used to draw line chart and penultimate value is used to show ‘last value change’. Same principles are used if data is retrieved from ‘Analysis’ or ‘MDX query’.