Create & Design Dashboards

All users with access to Kyubit Business Intelligence application could create new dashboards. To start creation of new dashboard, click ‘Create New Dashboard’ button on the dashboards view. New Dashboard will be opened in design view, ready to be designed and configured.

Dashboards consist of dashboard elements (tiles) that are arranged in dashboard columns. Dashboard columns can accept any number of tiles that will be displayed vertically. Each tile needs to be defined what kind of visualization and data it will display. By default, dashboard contains two columns and columns could be added and removed. Dashboard software
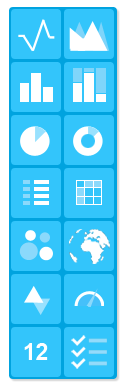
On every dashboard user can add 18 different types of dashboard element (tiles) that present some kind of data visualization. On the toolbar on the right, tile types are presented with descriptive icons.

To add tile to dashboard, drag-and-drop preferred tile type (visualization) from toolbar on the left to one of the column on the right. To remove tile (delete) from dashboard drag-and-drop tile from dashboard column to trash icon on the left, that is visible when drag-and-drop operation is started.

  • Line chart
  • Column chart
  • Column chart stacked
  • Column chart 100%
  • Area chart
  • Area chart stacked
  • Area chart 100%
  • Pie chart
  • Doughnut
  • Bubble chart
  • Table
  • KPI
  • Gauge meter
  • List
  • Geo Map
  • Card
  • Small Card
  • Combo chart
Dashboard software
At any time in design view, tiles could be rearranged with same dashboard column or moved to any position on another dashboard column. Simply drag-and-drop tiles to preferred location on any of the columns. New location of drag-and-drop tile will be displayed in blue color.

Dashboard software
  • When moving mouse over tile (while dashboard is in design mode) ‘Pen’ icon is displayed, which allows user to click and open tile configuration form.
  • Dashboard software

  • Enter dashboard general information: like title, description and, if you like, set child dashboard that will be opened as more detailed view on the same data, enabling users to have ‘drill down’ experience while using dashboards.
  • Dashboard software

  • ‘Tile Details’ is second tab on the tile form, where data to visualize will be defined. ‘Query/Analysis’ is input where user selects existing Analysis or Query (TSQL or MDX) to retrieve data to show in this tile visualization (‘Pie’ in this case). Existing ‘Analysis’ means that OLAP analysis is created in ‘Analysis’ part of Kyubit Business Intelligence application and current user has permissions to read at least. Existing Query (TSQL or MDX) means, that query is created in ‘Dashboards’ part of Kyubit Business Intelligence application and current user has permissions to read at least. If query user needs still does not exists, user could click on ‘New’ button and right away from tile form create new MDX or TSQL query. To select existing analysis or query, click on the ‘Select’ button and selection form of existing Analyses and Queries will be displayed. All analysis created within Kyubit Business Intelligence for which current user has at least ‘Read’ permission are displayed in selection form. Displayed list could be filtered by ‘Data Source’ for environments with many analyses. Same principles works for Query selection.
  • Dashboard software

  • After Analysis/Query is selected, click on ‘Test’ button in tile form to test visualization with selected analysis/query data.
  • Dashboard software

  • In tile configuration form, user still can change tile (visualization) type, if concludes that given data is more appropriate to show with different chart type.
  • Finally, click ‘OK’ in tile configuration form and tile will present data within dashboard area.
  • Dashboard software

  • While in dashboard ‘design view’ click on the ‘Details’ button to define dashboard ‘Title’, ‘Description’ on the ‘General’ tab.
  • Dashboard software

  • On the ‘Header/Footer’ tab set appropriately dashboard header and/or footer and its alignments text and alignments.
  • Dashboard software

Dashboard columns are containers for dashboard visual elements (tiles). While working in design mode, it is possible to add or remove dashboard columns. Dashboard can contain from 1 to 5 dashboard columns. To add column, remove column or edit column width click on the ‘Column’ button which is located above every dashboard column and select one of appropriate actions. For each dashboard column new column could be added on the ‘Left’ or ‘Right’ side of the selected column, changed width to 4 predefined column widths or to delete selected column.

Dashboard software

Kyubit Business Intelligence offers more than one way to access dashboards and particular saved dashboard.
To access available dashboards use:

  • http://yoursite/dashboards
  • http://yoursite/forms/dashboards.aspx


To access single dashboard use:

  • http://yoursite/dashboard/123
  • http://yoursite/forms/dashboard.aspx?dashboardID=123