Release Notes for 'Kyubit Business Intelligence' 3.5
We are announcing new release of 'Kyubit Business Intelligence' 3.5 and invite you to download and improve your BI tools.
Read new version highlights that will give you quick insight what you might expect from this summer Kyubit release.
New analysis features as well as new Dashboard options will bring you more interesting tools and more sophisticated possibilities
for your BI environment.
Multipage Report
Add various Dashboards and Analyses to one Multipage Report, that will show Tabs on the top to quickly select requested content.
Multipage Report groups dashboards and analyses of common interest, so users do not have to look for the same on several different places on the portal.
After you create Multipage Report simply send link to someone, who will be able to see all related BI content without having to leave the page.
Decomposition Analysis
New type of OLAP analysis is
Decomposition Analysis which offers some other benefits compared to existing Grid/Chart analysis.
Decomposition has sequential nature. Level by level is added to analysis, visible at all times with option to select any member on any level in decomposition analysis
to filter and isolate data of analysis interest. This approach makes easier analysis while discovering data in depth with option to refine analysis at any time.
On each level is displayed cumulative applied filters, each level can be exported to Excel, PDF or continue analysis with traditional Grid/Chart analysis.
Saved decomposition analysis could be also used on dashboard for visualizations or KPI metrics.
From top to bottom each level displays only data is filtered by selected members on the levels above.
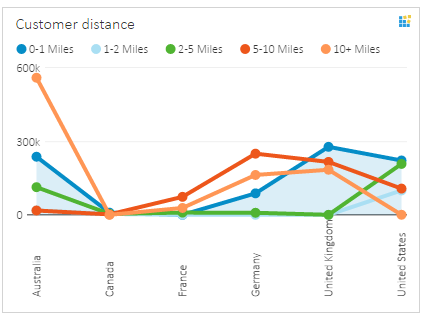
Value Labels on the Dashboards
There are new options available to customize which Value Labels will be visible on the charts displaying data on the dashboards.
While configuring
Dashboard Tile display options, user can opt to display only Value Labels for higher values or specific Categories and Series.
Displaying Value Labels enables users to see values for chart elements immediately without having to move mouse over specific chart regions and Value Labels
are also visible when exporting data to PDF document or connecting to dashboards with mobile devices using Mobile view options.
Dashboard Visualization Fullscreen Slide Show
Dashboard has new feature to display all tiles as slides one by one over Full screen, making this feature ideal for presentations on the bigger screens that will
continue to display tiles with configurable delay between tiles and configurable caching of data for displayed tiles.
Customize Dashboard Visuals
Dashboard designer has more options to
customize Dashboard outlook and move user experience closer to expect.
Choose from several color schemes for whole dashboard or for particular tile. With some workaround apply your own color scheme.
Set dashboard tiles borders as round, square or without border. Position charts legend on the top, right or without legend.
Show Only Specific Categories/Series
OLAP analysis, MDX and SQL queries returns data structures that consist of categories and series to be visualized on the dashboard charts. In dashboard 'Design View' user can select to show only particular categories or series and narrow focus to the data of current interest.
Dashboard Chart - Trend and Average Lines
Display a Trend line or Average of values line for particular series of data on the chart, and make easier judgements to end user
observing data on the dashboard charts. Lines are displayed on the PDF export and Mobile view as well.
Pivot values for Tile
On any chart element switch Categories/Series by selecting "Pivot" option. If query/analysis returns data in the form of Columns/Rows not appropriate to display as Categories/Series, solve the problem with one click.
Export Dashboard tiles values to Excel
Any tile on the dashboard while opened in 'Large View' has option to export chart values and its image to Excel.
Quickly export data to send to someone or do other operations in Excel.
Other features and improvements...
- Display Measures for analysis in multiple sub-folders (Display Folders), if defined in your BI project.
- While exporting Dashboard as Simple PDF Export, Table dashboard element with its values will be included.
- While adding filters for Dashboard, only data sources that are related to already added tiles on the dashboard will be displayed.
- Adding 'Named Sets' to series while working in analysis chart view.
- Moving around Tile Edit form while in Dashboards design view.
- Support for Cyrillic letters while exporting dashboard to PDF.
- Fixed - Testing user calculated members that include CURRENTMEMBER
- Analysis chart, displaying full name of categories (Text is not cut)
- Dashboard and Decomposition Drillthrough results export to Excel file.
- Dashboard charts - displaying category name label in a larger volume (Previously only 5-7)
- Dashboards mobile view, display of applied dashboard filters.
- Small improvements and corrections...
We appreciate your feedback!